
Report & Analyze
Customizable views allow you to extract meaningful insights from your Slates.
Once your Slates are properly configured, and you’re capturing data for your assets, you’ll want to generate reports that will give you instant access to what matters most to your organization. List Views and Map Views, both features available in the Dashboard, are key to extracting useful information from your Slates. And if you need even more analysis tools, you can always export your slate data into a spreadsheet application of your choice.
List Views
List Views, a feature available in the Dashboard, provide a powerful way to view the data stored in your Slates. We’ve given you a lot of flexibility when designing your slates, and List Views come with customizability as well.
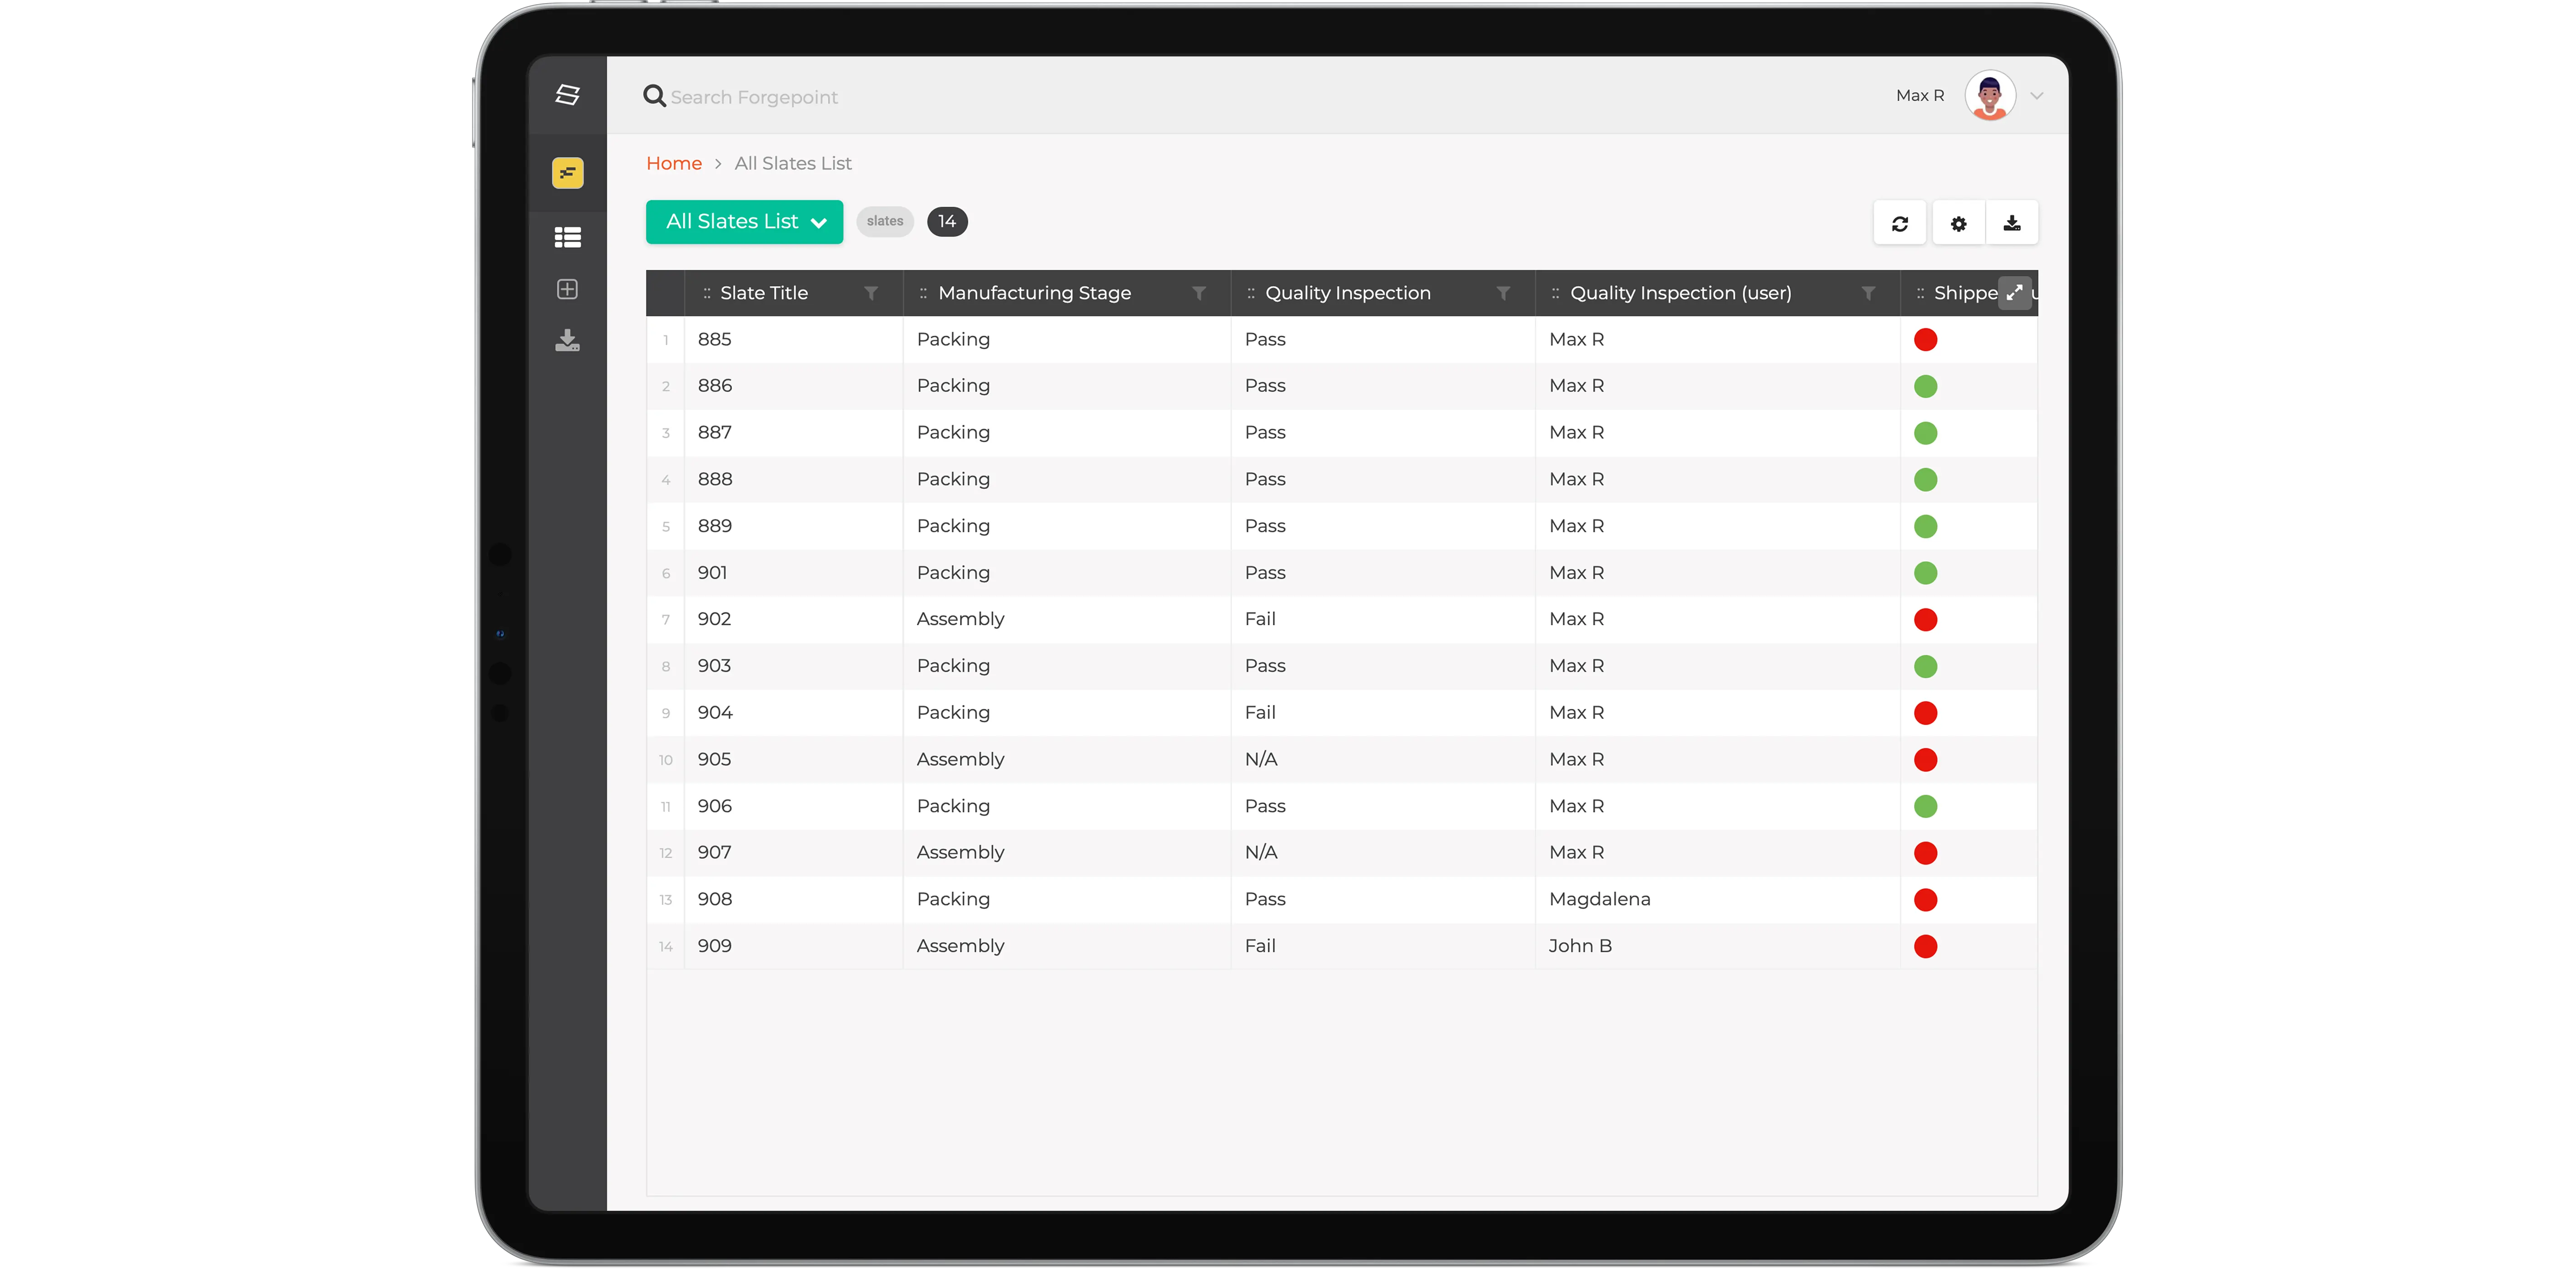
List views in the Slate Pages Dashboard
Once configured, a List View will provide a spreadsheet-like presentation of the data on your slates. With this visualization, each row of the list will represent a slate, and you get to define the columns, based on the fields you defined for your slates or templates. You may be storing a lot of information on your slates, so we’ve given you ways to narrow down that data to display what is meaningful to you. When configuring a List View, you’ll have control over Filtering Rules, as well as the Columns in your list. Filtering Rules can filter which slates are displayed in a view. A view can have a combination of rules. For any field, you can configure the following:
- If the field has or doesn’t have a value
- If the field exists or doesn’t exist on the slate
Additional rules can be configured for the data that is stored on your slate:
- If a field equals or doesn’t equal a specific value
- For Number and Date fields, you can configure Less Than, Less Than or Equal To, Greater Than, and Greater Than Or Equal rules, allowing you to create ranges of acceptable values for a slate to be included in your view.
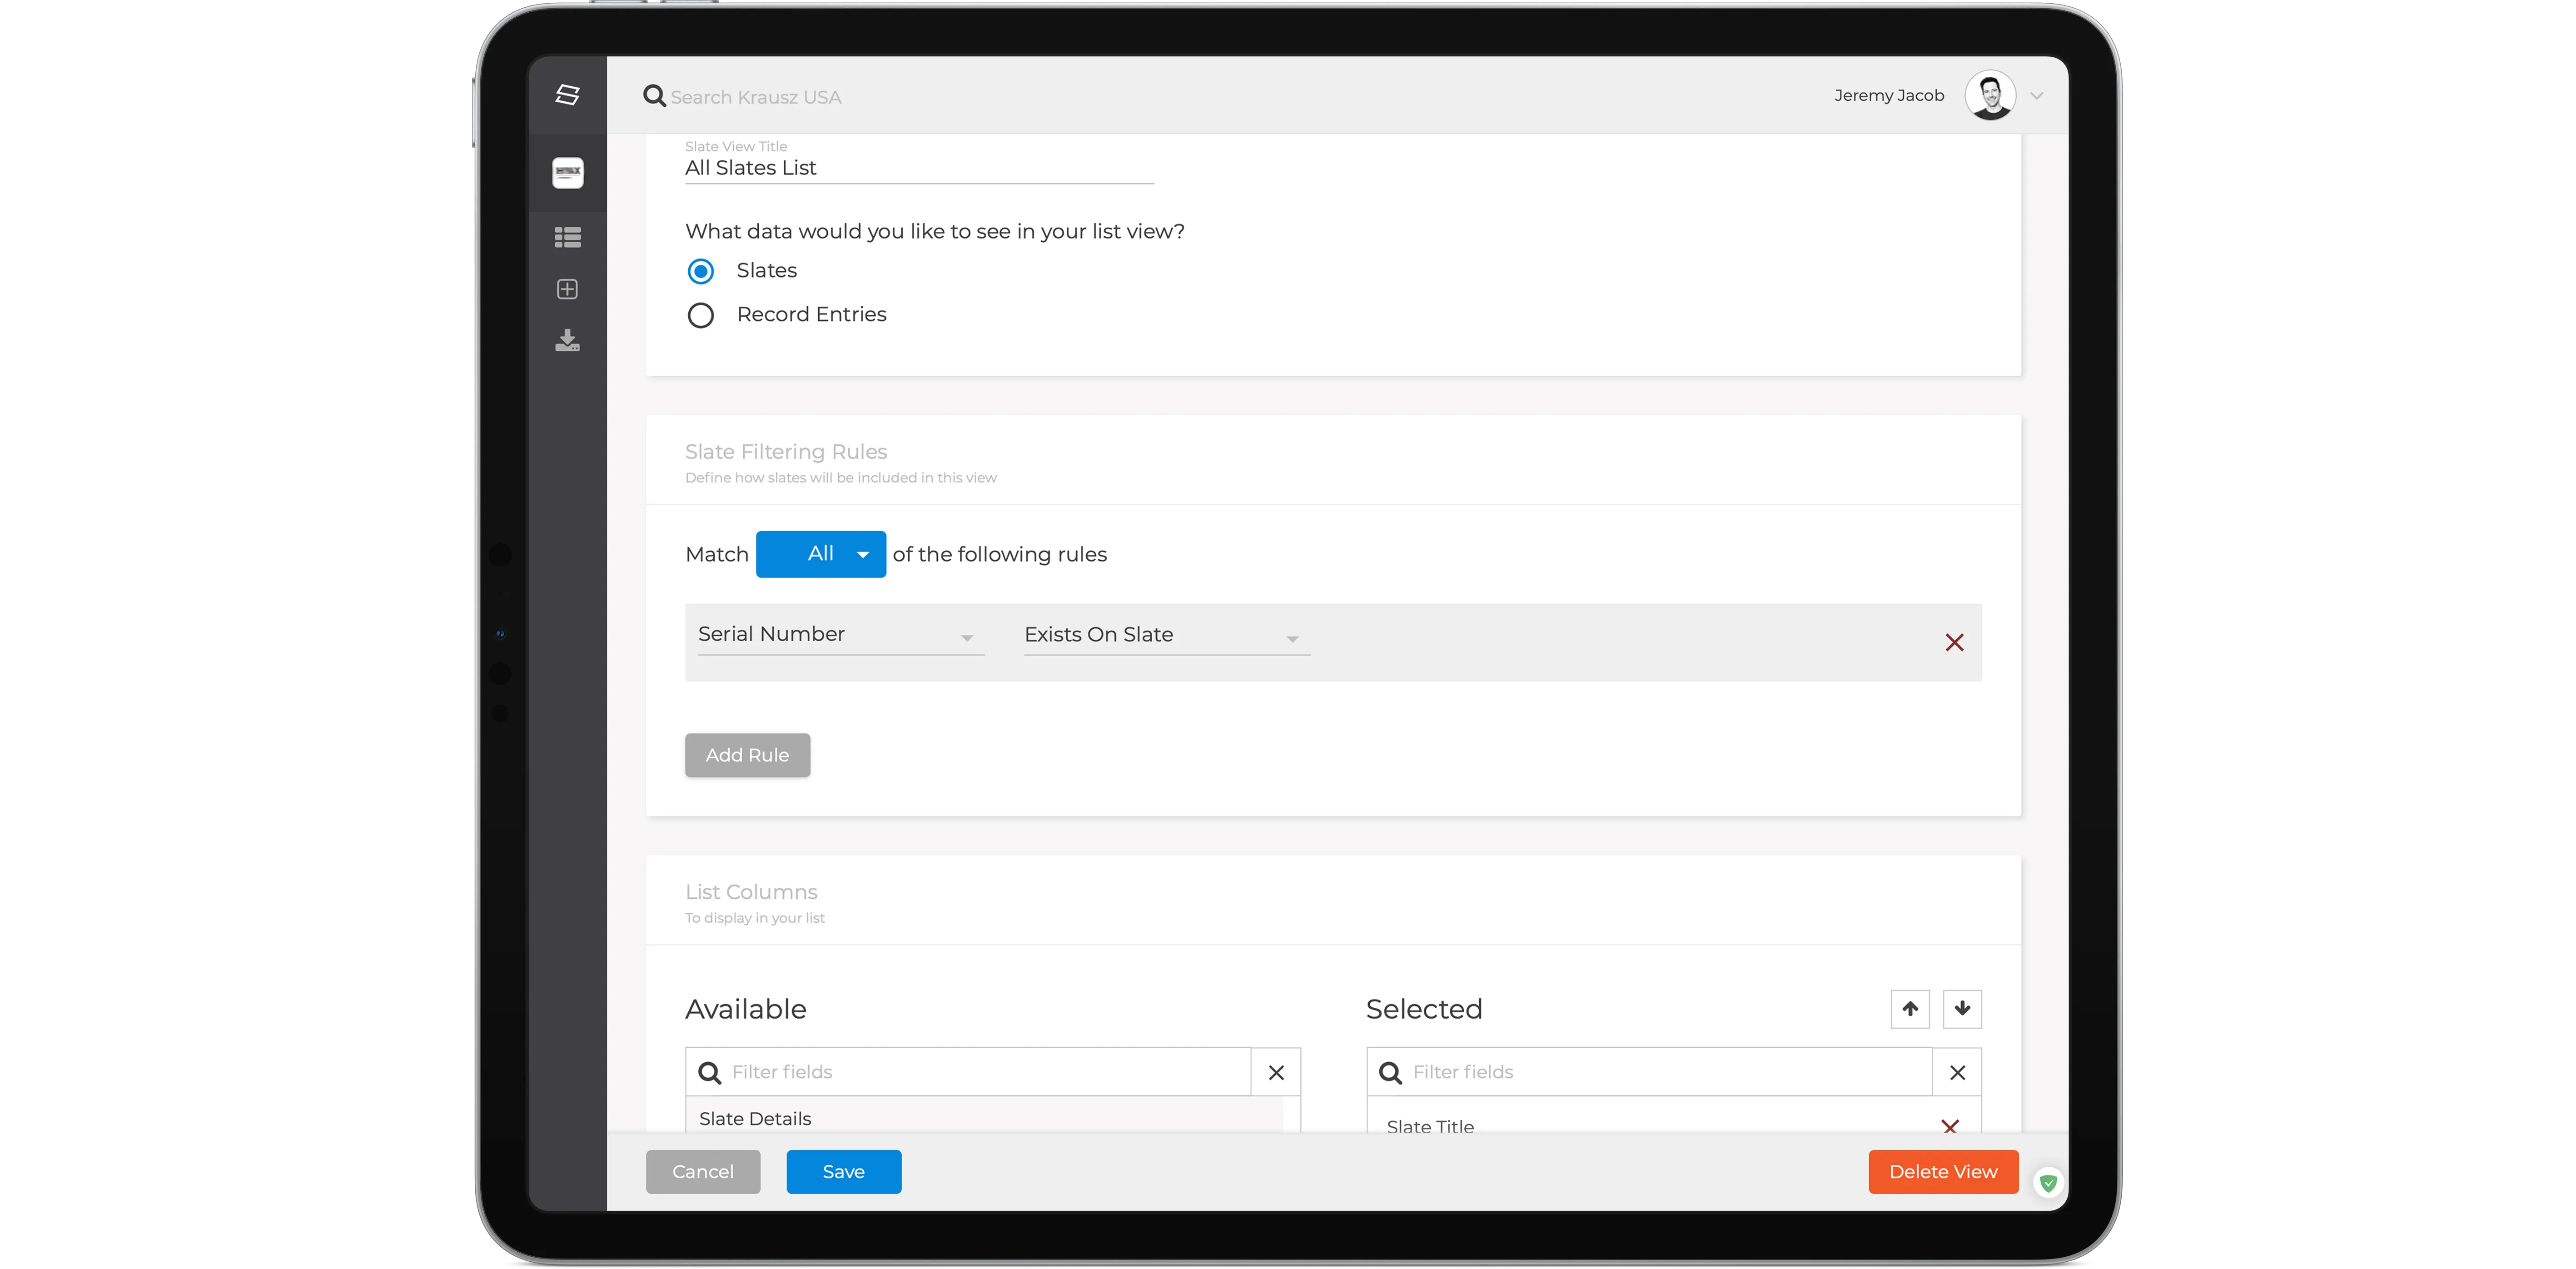
List view rule configurations
The Columns of a List view are configured by you, and they are based on the fields from your slates or templates. Each column can be:
- The value of a specific field
- The name of the user that last changed the data in field
- The date and time (timestamp) of the last modification to a field
Map Views
If you’re taking advantage of the Location field on your Slates, then Map Views will be valuable to you. Giving you a map with all of your assets, you’ll be able to quickly visualize where your assets are located with pin markers at each slate’s location.
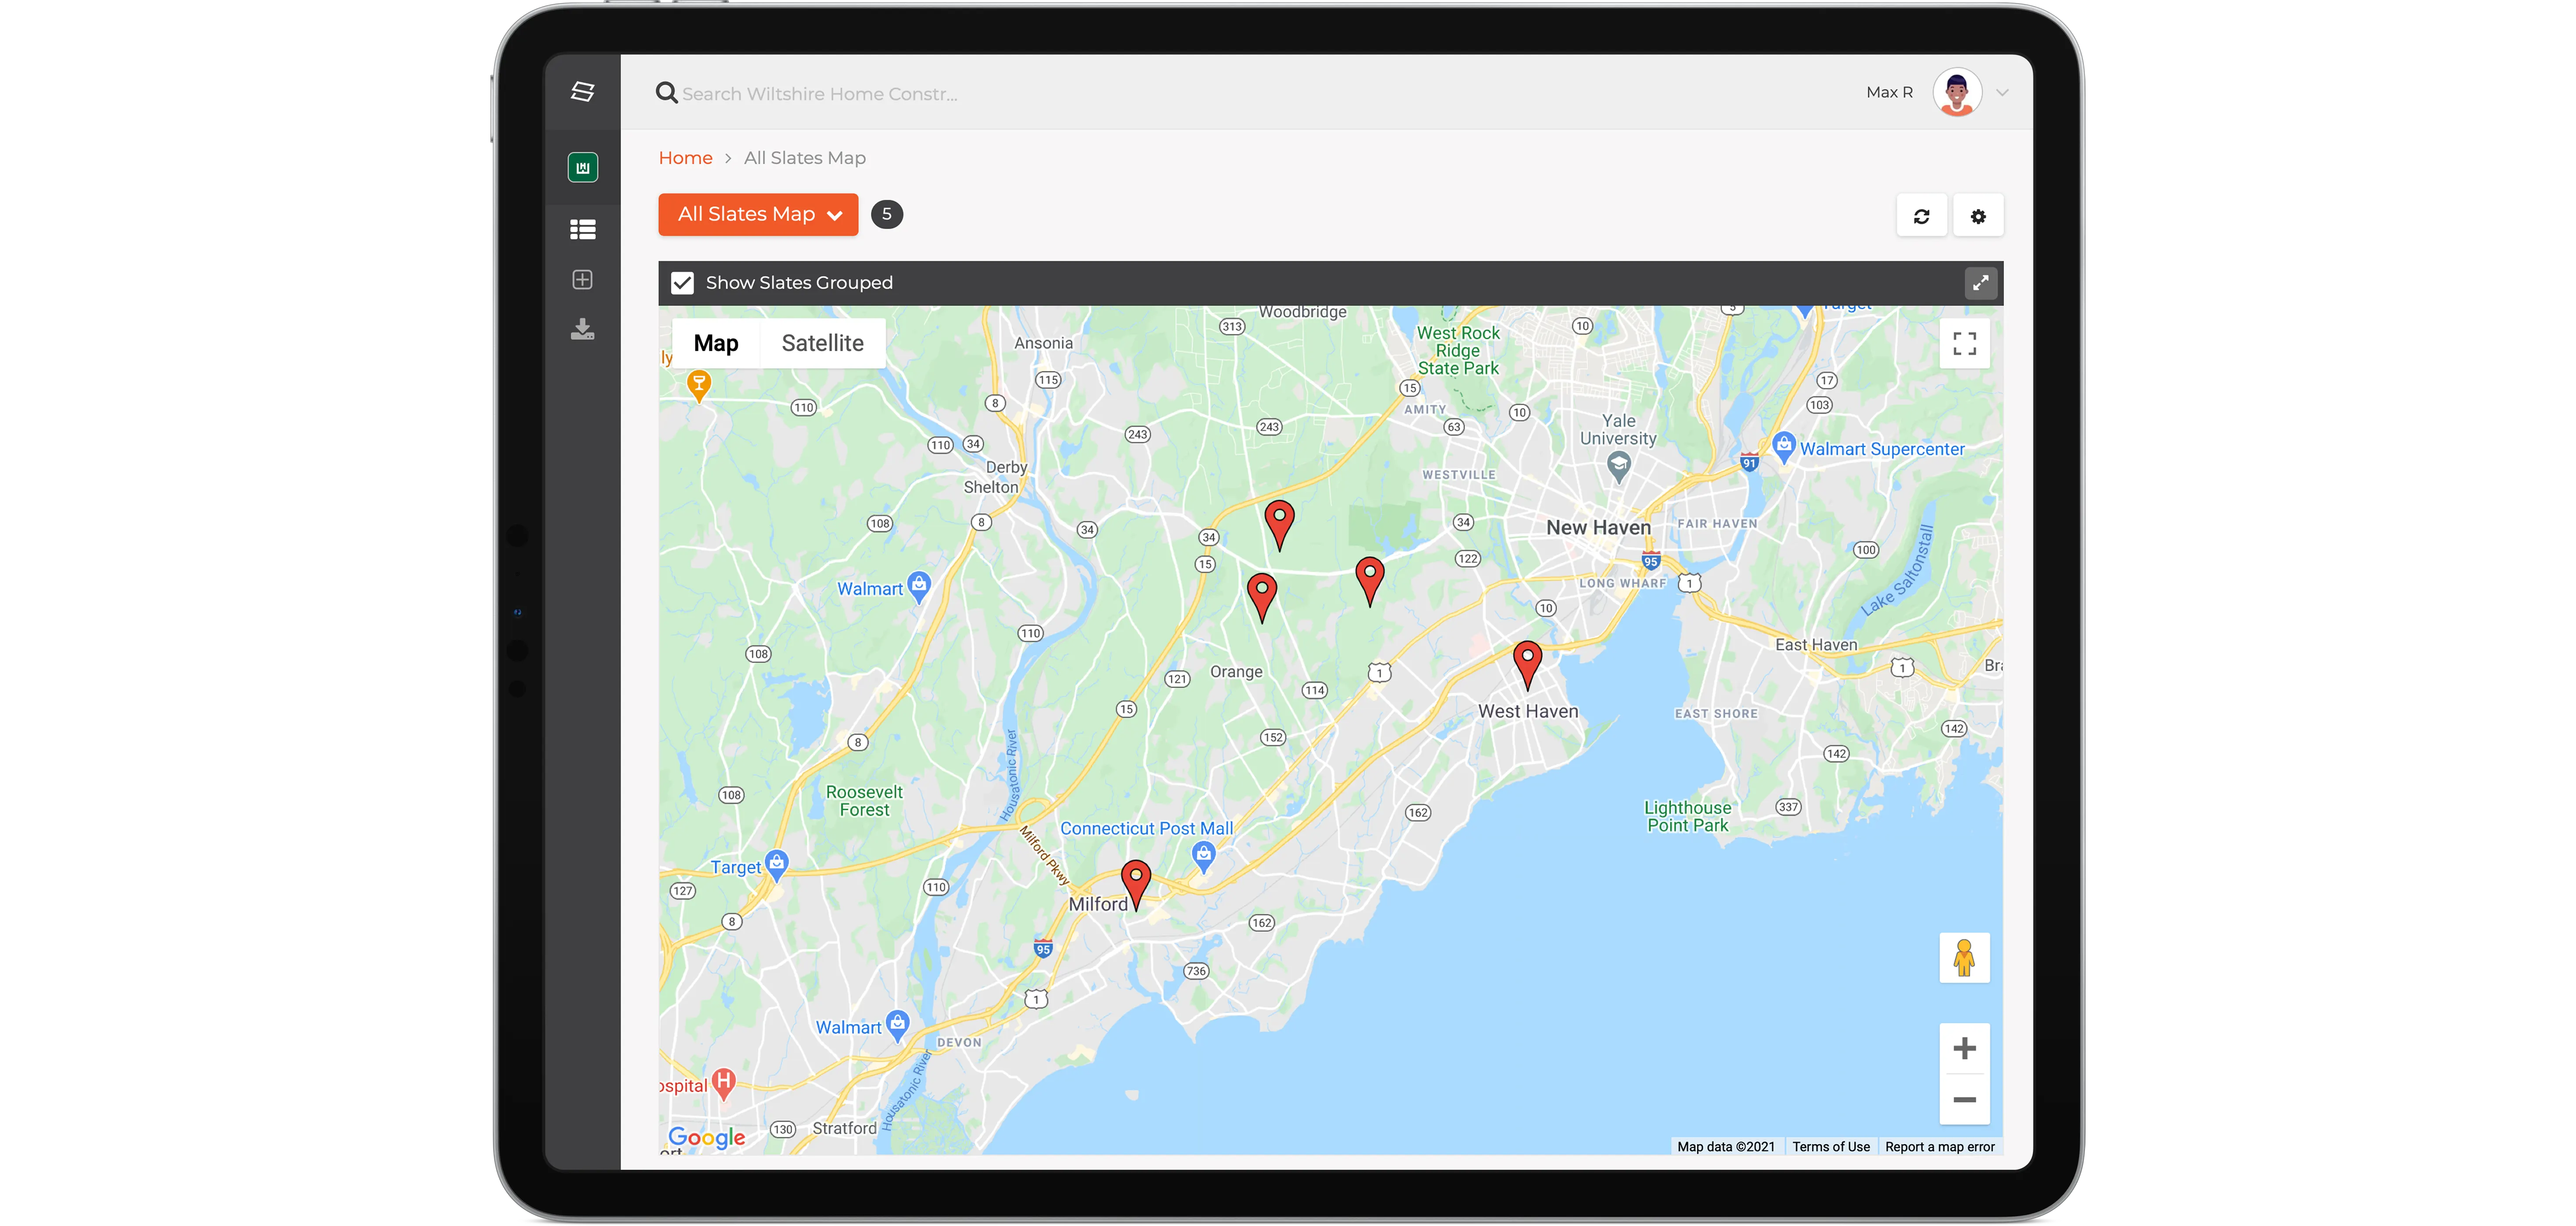
Map Views in Dashboard
Like List Views, you can customize your Map Views to only show certain slates on a map by configuring Filtering Rules.
Additionally, when configuring a Map View, you will have the option to create custom pin colors, where each color can be assigned to slates that meet specific criteria.
Exports
Sometimes you just want to get your data into a spreadsheet, like Excel or Google Docs, and really crunch some numbers! Exporting is easy in the dashboard and works similar to List Views.
Create an export job from scratch and customize Filtering Rules as well as Columns. Once saved, the export job will compile all the data for your slates into a CSV file, which can then be downloaded to your desktop. Most spreadsheet applications, like Excel or Google Docs, support the CSV format.
Already have a List View with the perfect configuration? Quickly generate an export job right from a List View, and all those configuration options will be applied automatically.
Search
Searching is an important tool during analysis, and with Slate Pages, you’ll be able to search all of your Slate data, from the app or dashboard. When you make changes to your Slates, that data is immediately indexed and searchable.
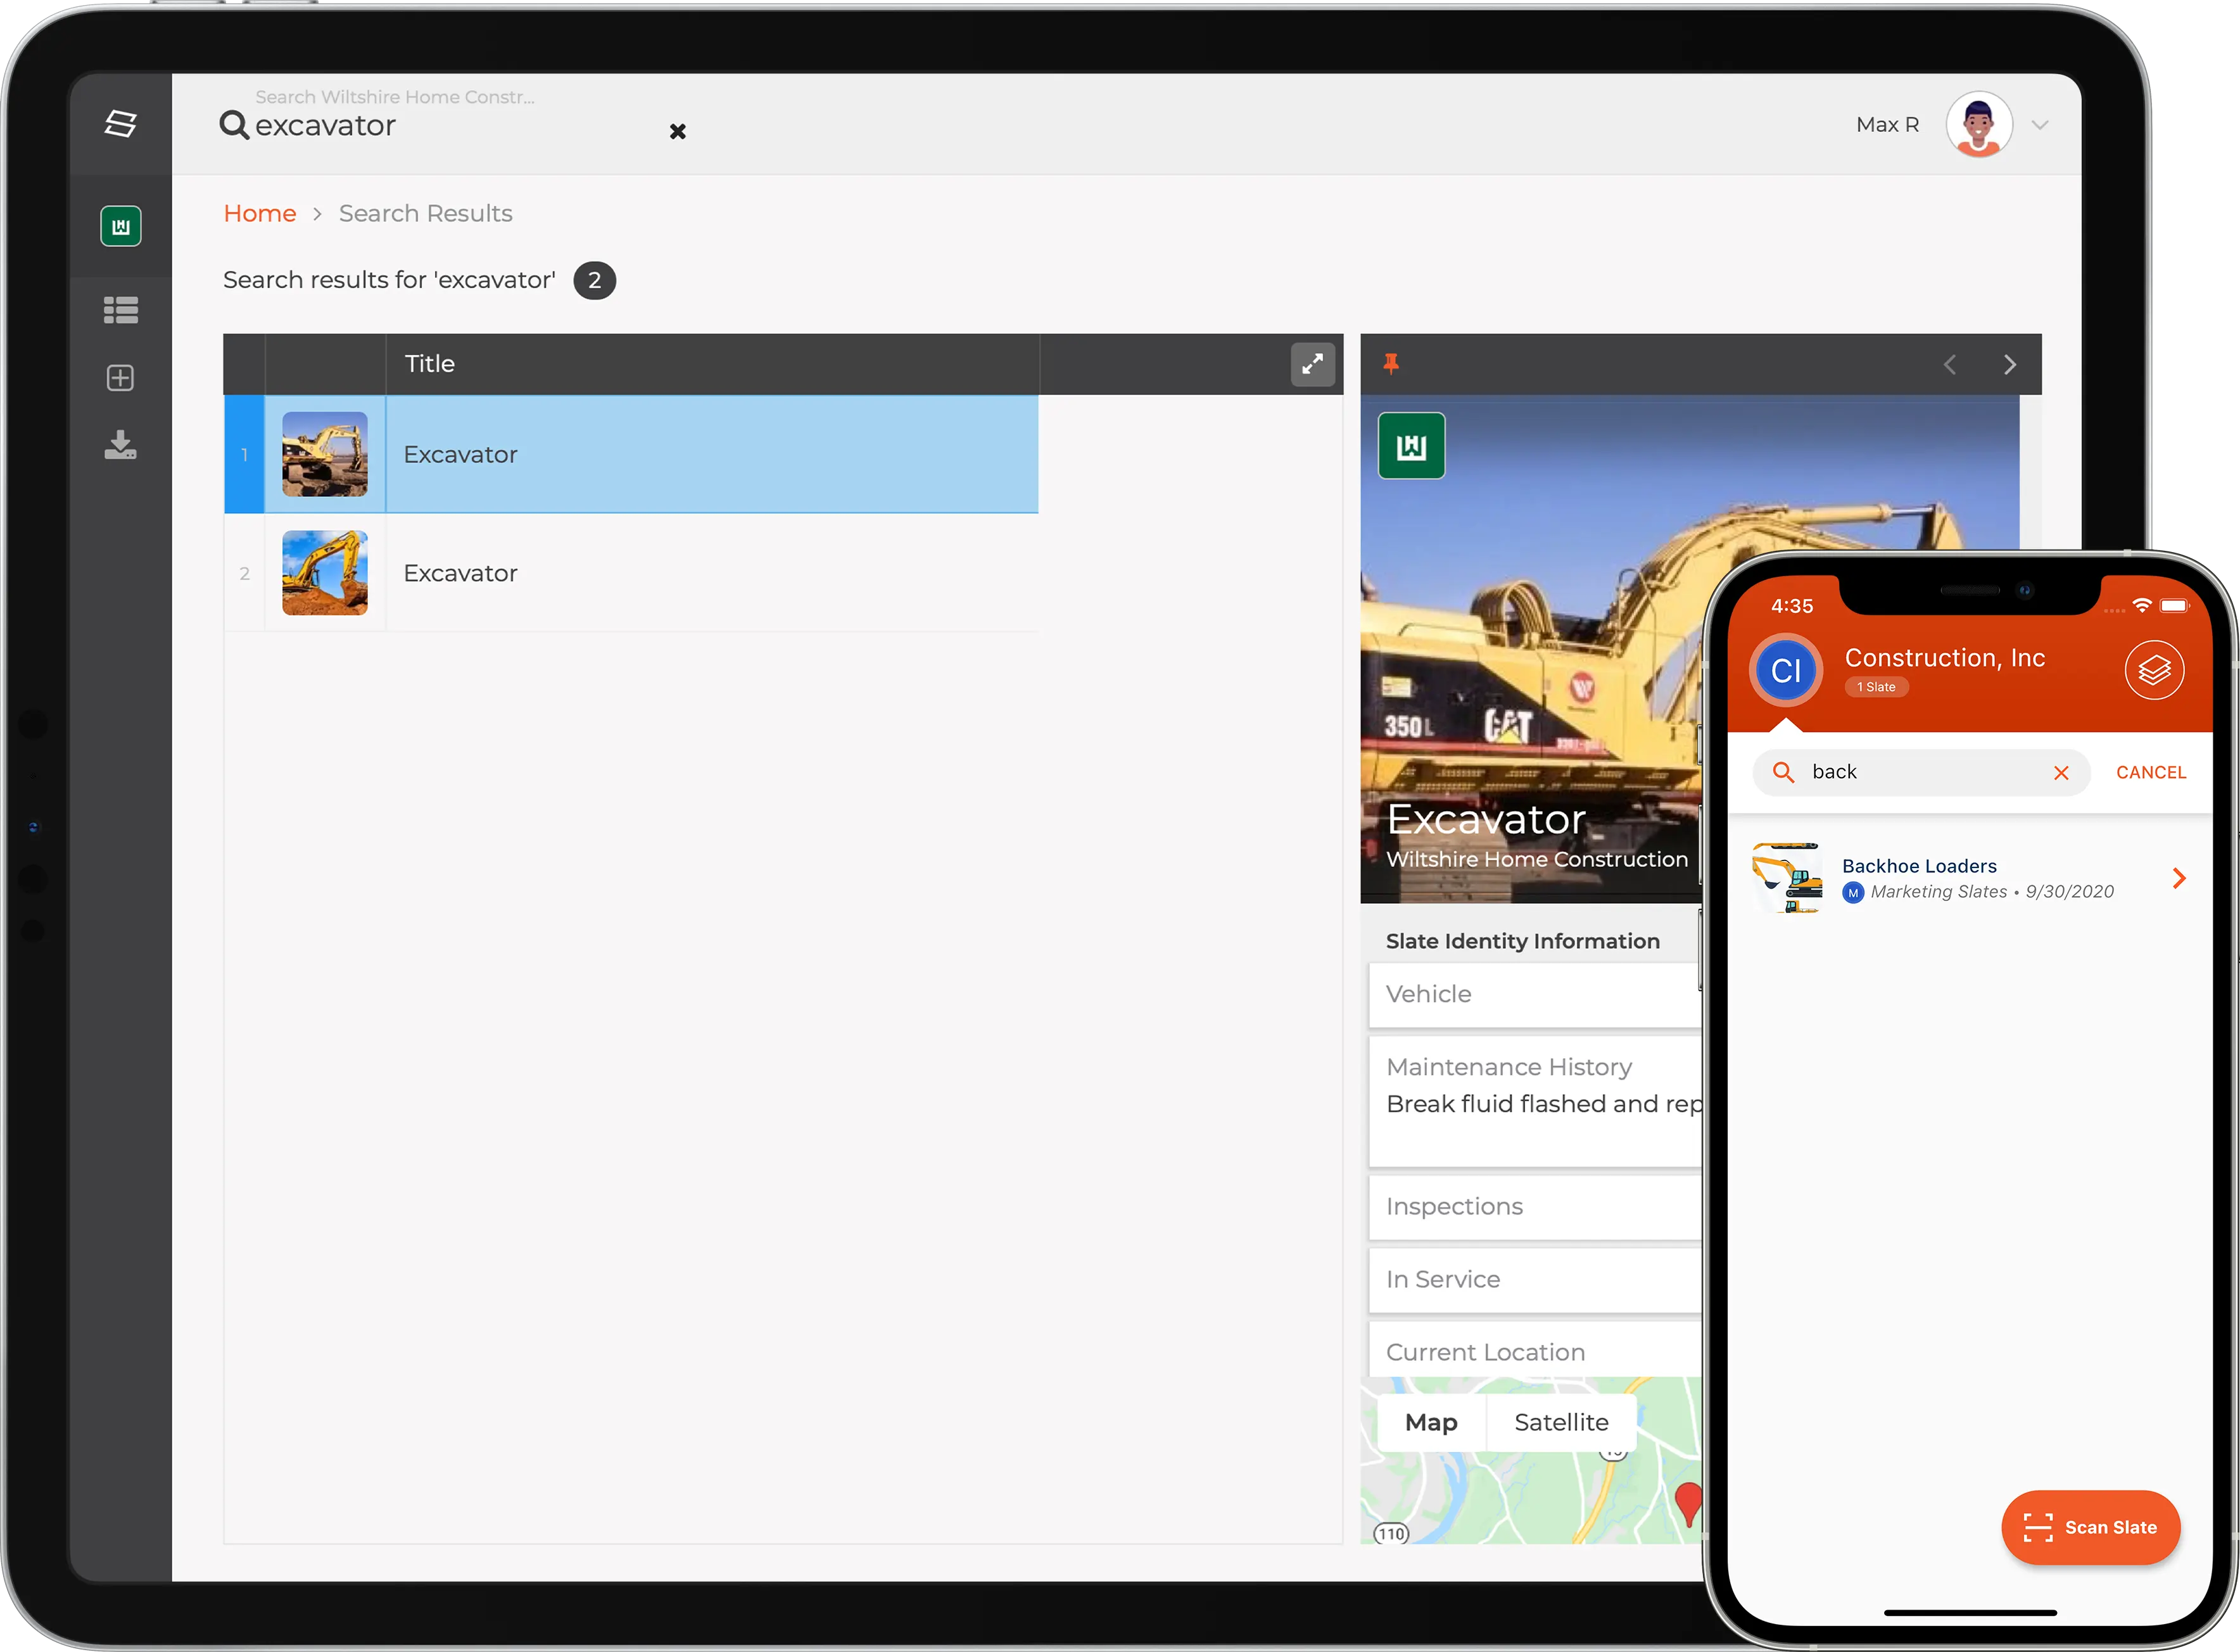
Searching in Dashboard & App
Discover how Slate Pages can work for you
Slate Pages is fully customizable to fit your need.